

“DASHBOARD” for Law Firms

There are “fads” in everything that happens and it could not be otherwise in the entrepreneurial world! For some time, the word “dashboard” took the place of the so-called management reports and, for this reason, I will adopt it, too (but it is the same thing).
To the legal market, there is a very important tool and that generates several indicators that give an idea of the “temperature” of the office activity which is the famous (and infamous for those who must fill it out) TIMESHEET.
With it, the partners or coordinators have a tool that enables the efficient management of the team, as well as resource allocation, performance evaluation, and on the client’s side, the partner can (and must) manage all the matters that are being addressed internally, but although it is the fundamental tool for the operational management, several offices are still reluctant to adopt it and make it obligatory.
The Timesheet is important for the good management of any office, but it is not the only tool to be used. There are other indicators that must be easily available to the managers in order to help them in the governance (another buzzword) of their businesses. And here governance means the legal operation, the organization, the team management, the financial/ economic management, marketing and strategy.
The DASHBOARD is the set of tables and graphs that are presented intuitively and condensed in one or two pages so that the managers will have a global view of their business and that must be used in the strategic meetings of the company.
One important piece of observation has to do with the origin of data and how easily those data are obtained. The adoption of an up-to-date and integrated platform that enables the quick capture of information that will make up the dashboard is essential for the efficiency and reliability of this governance tool.
Below we have some examples of indicators that can become part of a DASHBOARD:
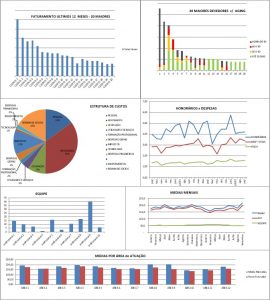
Financial/economic indicators
Evolution of revenues in the period (semester or year-end)
Graph of the revenues per client, with emphasis on the 20 biggest ones.
Biggest debtors (with aging)
Average receipt time
Cost structure and its evolution
Graphs of the income and expenses over the period
Total profitability and total per cost centers
Revenues per business area or per field of activity.
Non-financial indicators
Team structure per type of professional
Allocation of professionals per area
Evolution of the team along the period
Average of hours (marked, cut, discounted, charged and received)
Per type of professional
Per area of performance
Per cost center or branch
Clients gained per period and their persons in charge
Clients lost (mentioning the reason) and their persons in charge
The Institutional Indicators (that can become part of an auxiliary dashboard)
Published papers (academic ones)
Articles published in the media (who generated it and which media)
Visits in own site (Google Analytics)
Followers on the Linkedin (corporate and professionals)
Events generated
Speeches given
The support by an outsourced consultancy firm that is experienced and exempt from internal interactions may indeed help the solving of this challenge, as well as the definition of the specific model to each office/company.